Please Signup
I accept all terms and conditions
I accept all terms and conditions
Myanmar
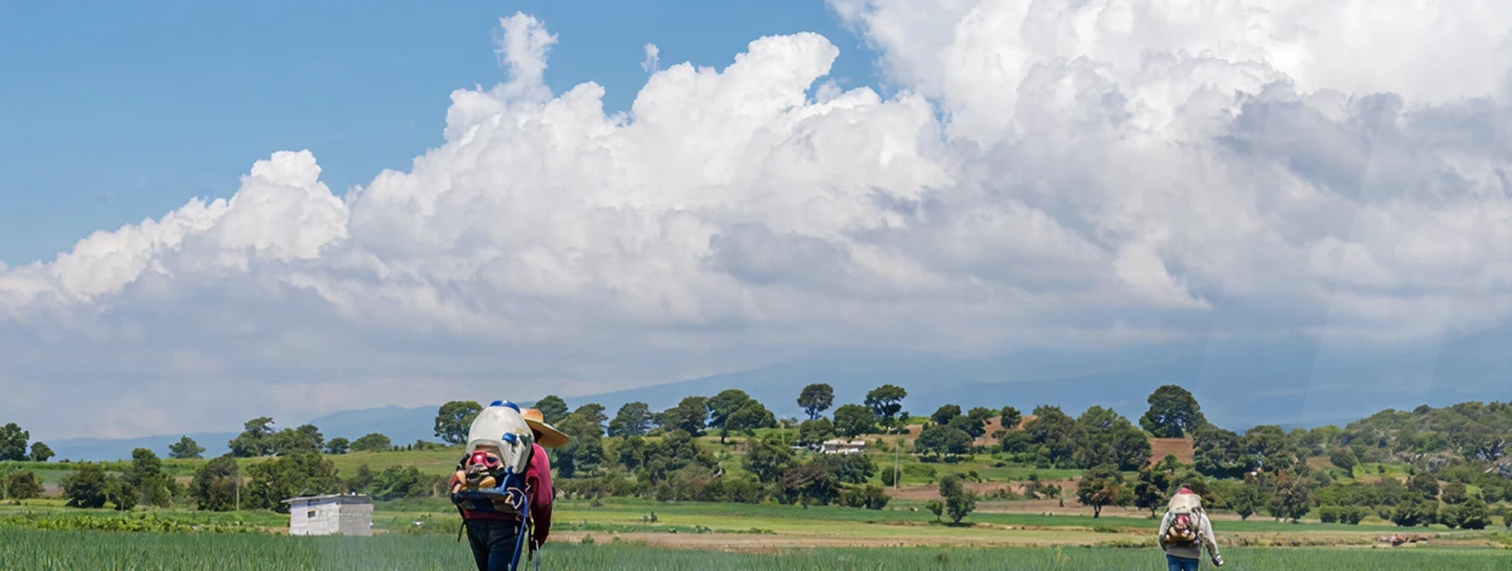
Myanmar's climate is influenced by monsoon winds and consists of three seasons: the cool northeast monsoon (late October to mid-February), the hot intermonsoonal period (mid-February to mid-May), and the rainy southwest monsoon (mid-May to late October).
Background
Geographic Profile
Demographic Profile
Economic Profile
Trade Profile

Total agricultural land area World Bank, 2021

Contribution of agriculture to total GDP

Percentage of the labor force in agriculture
Total agricultural land area World Bank, 2021
Contribution of agriculture to total GDP
Percentage of the labor force in agriculture
Myanmar’s climate is influenced by monsoon winds and consists of three seasons: the cool northeast monsoon (late October to mid-February), the hot intermonsoonal period (mid-February to mid-May), and the rainy southwest monsoon (mid-May to late October). Precipitation varies regionally, with coastal areas receiving over 200 inches annually, while the central region sees only 20 to 40 inches. Elevation affects temperature fluctuations, particularly in places like Mandalay, with average daily temperatures ranging from 79 °F to 82 °F, and cooler temperatures of around 71 °F on the Shan Plateau.
According to the Myanmar Census 2024, the total population of Myanmar is estimated to be 51,316,756 as of September 30, 2024. This figure comprises an enumerated population of 32,191,407, along with an estimated 19,125,349 individuals residing in areas that were not fully surveyed. Among those counted in the census, there are 15,105,215 males and 17,086,192 females, highlighting a notable predominance of females in the population. Specifically, males constitute 46.9% of the total, while females account for 53.1%. Additionally, the census reveals that 31% of Myanmar’s population lives in urban areas, compared to 69% who reside in rural regions.
According to Statistics Times the population growth rate for 2024 is 0.66%, which ranks Myanmar as 131st out of 237 countries in terms of growth rate.
According to the World Bank Group, Myanmar’s GDP stands at US$ 74,079,772.65, with a GDP per capita of US$ 1,359.30. The country has experienced an annual GDP growth rate of -1.0%. In comparison, the previous year, Myanmar’s GDP was US$ 66,757,619.00, with a GDP per capita of US$ 1,233.20, and it had an annual GDP growth rate of 1.0%.
According to The Observatory of Economic Complexity, in 2023, Myanmar ranked as the 103rd most complex economy out of 132 countries, according to the Economic Complexity Index by Trade. Additionally, Research ranked it 120th out of 137 countries on the same index. The country’s product exports totaled $21.8 billion, placing it 75th among 226 countries, with an export per capita of $403, which ranks it 157th out of 209 countries. The exports experienced a decline, with a growth of -$5.17 billion. On the import side, Burma imported products worth $24.7 billion, ranking 79th out of 226 countries. The per capita imports stood at $457, positioning the country at 172nd out of 209 countries.
Top Imported Products
Top Import Partners
Agricultural Imports
Top Exported Products
Top Export Partners
Agricultural Exports
Get the latest policy insights, research highlights, and knowledge resources from across Southeast Asia delivered straight to your inbox.