Please Signup
I accept all terms and conditions
Malaysia
Malaysia boasts a wealth of natural resources, including substantial deposits of tin, petroleum, natural gas, timber, palm oil, and rubber. The country is also a prominent producer of various minerals such as bauxite, copper, gold, and iron ore. Furthermore, Malaysia is exploring its potential in rare earth elements, paving the way for future development in this vital sector.

Background
Geographical Profile
Demographic Profile
Economic Profile
Trade Profile

Sqm land area

Contribution of agriculture

% of labor force in agriculture
Malaysia consists of both peninsular and insular regions, both experiencing a tropical climate influenced by northeast and southwest monsoons. The climatic year includes four main periods: the northeast monsoon (November to March), the first intermonsoonal period (March to April/May), the southwest monsoon (May/June to September/October), and the second intermonsoonal period (October to November).
The region has generally high temperatures, averaging around 80 °F (27 °C) in lowland areas, with coastal regions in East Malaysia seeing temperatures ranging from the low to mid-70s °F at night and about 90 °F during the day. Rainfall is significant, with annual averages around 100 inches (2,540 mm) on the peninsula, while Sabah receives 80 to 140 inches (2,030 to 3,560 mm) and Sarawak over 120 inches (3,050 mm).
Flooding can occur due to the heavy rains from both monsoons, particularly in certain coastal areas, but the region is not typically impacted by tropical cyclones.
Total population of 35,126,298 (2023) with 1.20% annual population growth
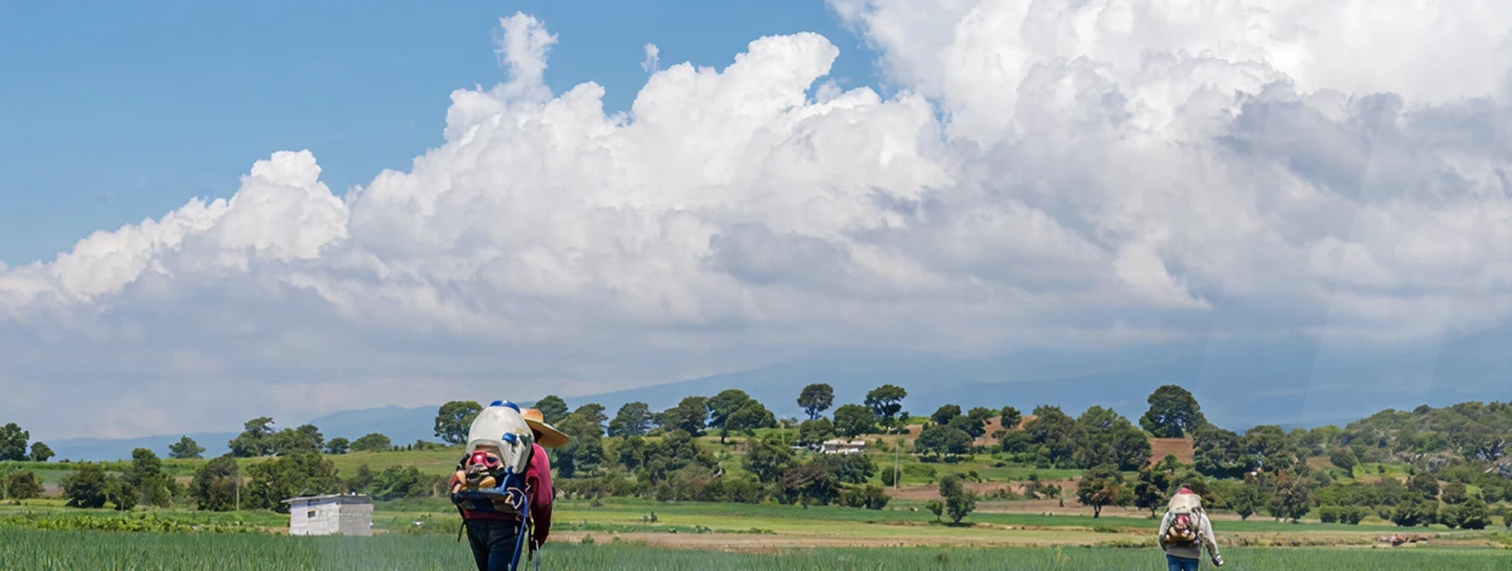
In Malaysia, the agricultural workforce plays a vital role, comprising about 10% of the total workforce, which translates to approximately 1.566 million individuals engaged in agriculture, fisheries, and forestry. Although the agriculture sector continues to be significant, it is experiencing a natural evolution as the economy progresses and transitions towards industrial and service industries. This shift presents opportunities for growth and the potential to enhance productivity within the agricultural field, while also adapting to the changing economic landscape.
Agricultural Products
Malaysia’s agricultural sector plays a vital role in the country’s economy, with a strong emphasis on industrial commodities such as palm oil and rubber. In addition to these key exports, the sector is diverse, producing a wide array of food crops, including rice, fruits, and vegetables. The country also takes pride in its production and exportation of various other products, such as cocoa, pepper, coffee, tea, and an assortment of fruits and coconuts. This dynamic sector provides employment for approximately 1.5 million individuals, contributing to both livelihood and sustainable development in the region.
Natural Resources
Malaysia boasts a wealth of natural resources, including substantial deposits of tin, petroleum, natural gas, timber, palm oil, and rubber. The country is also a prominent producer of various minerals such as bauxite, copper, gold, and iron ore. Furthermore, Malaysia is exploring its potential in rare earth elements, paving the way for future development in this vital sector.
Top Imported Products
Top Import Partners
Agricultural Imports
Top Exported Products
Top Export Partners
Agricultural Exports
Get the latest policy insights, research highlights, and knowledge resources from across Southeast Asia delivered straight to your inbox.
